CSC034 Fundamentals of Information and Communication Technology Assignment 2 Semester 2 | UiTM
| Category | Assignment | Subject | Computer Science |
|---|---|---|---|
| University | Universiti Teknologi MARA | Module Title | CSC034 Fundamentals of Information and Communication Technology |
CSC034 Task
This individual assignment requires students to create a Cyber Security Incident Report Worksheet using spreadsheet software. As a cybersecurity analyst, your department requires this report worksheet to help monitor and analyse cyber threats effectively.
Students will use the provided dataset to structure their worksheet, organise cyber security incident data, and perform analysis using various spreadsheet functions. This report will help organisations make informed decisions on protecting digital data and devices from cyber threats.
CSC034 Objective
The main purpose of this assignment is for students to apply spreadsheet software knowledge to perform data manipulation, analysis, and visualisation.
The assignment will assess their ability to:
- Manage and organise data effectively
- Apply spreadsheet functions for analysis
- Use charts to visualise key trends
- Interpret data insights related to cybersecurity incidents
The content of the assignment will gauge students’ ideas on computing applications in their daily lives. Computers are everywhere and are being used not only in our daily life but also in work by other industries. Students are expected to gradually acquire a better understanding of the importance of technology skills in supporting other industries for better productivity and efficiency during the assignment implementation.
CSC034 Method
Analysis on this assignment must be created using a spreadsheet software only (Example: Microsoft Excel or Google Sheets).
Follow the stated requirements below while creating your report and analysis. 3.
The output of this assignment should come in the form of a spreadsheet file created using a spreadsheet software.
Buy Answer of This Assignment & Raise Your Grades
Request to Buy Answer
Requirements:
Step 1: Data Preparation
Download the provided dataset Cyber_Security_Threats.xlsx from UFUTURE (Course Content >> CSC034 – INFO).
Explore the dataset, which contains two sheets: THREAT_DATA (reported incidents) and THREAT_CATEGORIES (classification of threats).
Create a new sheet named ‘THREAT_ANALYSIS’ and copy all data from THREAT_DATA into it.
In the THREAT_ANALYSIS sheet, insert a new column between columns D and E, and name it ‘Threat Category’.
Use the data validation tool (Validation criteria: List) to enter data into the ‘Threat Category’ from the THREAT_ANALYSIS sheet using the list from the ‘THREAT_CATEGORIES’ sheet.
Sort the Region column in the THREAT_ANALYSIS sheet in ascending order. Sort the ‘Threat Category’ in the list (in ascending order).
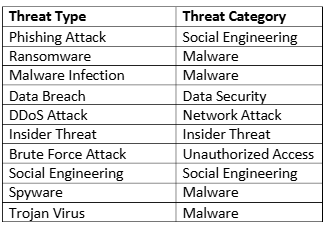
Assign appropriate categories to each threat type based on the table below

Step 2: Data Analysis
In the THREAT_ANALYSIS sheet, complete the following tasks:
At cell C54, label Most Common Threat Type. Calculate each unique threat type one by one (10 Threat Types) using COUNTIF. Place the most common threat type answer at D54 and change the name to C54 “Most Common Threat Type – threat type answer”.
Type in cell C57, the label Total Incidents per Category, and calculate using COUNTIF. Place the answer starting at D58 until D63 for each category. Cell C58 starts with the label ‘Data Security, cell C59 with the label ‘Insider Threat’, cell C60 with the label ‘Malware’, cell C61 with the label ‘Network Attack’, cell C62 with the label ‘Social Engineering’, cell C63 with the label ‘Unauthorised Access’.
Type the label Incidents Frequency per Region in cell C66 and place the region label starting at cell C67 with ‘Africa’, cell C68 with ‘Asia’, cell C69 with ‘Australia’, cell C70 with ‘Europe’, cell C71 with ‘North America’ and cell C72 with ‘South America’. Place the answer with a specific function/formula starting at cell D67 for each region.
Find the average severity score using a function. Type the Average Severity Score label in cell E54 and calculate the average in cell F54.
Find the maximum and minimum incidents with a region using appropriate functions and place your maximum answer at cell H54 with the Max Incident Frequency label at cell G54 and your minimum answer at cell H55 with the Min Incident Frequency label at cell G55.
Find the Severity Level that consists of “Critical”, High’,’ Medium” and “Low”. Type ‘Severity Level’ in cell F57, label ‘Critical’ in F58, ‘High’ in F59, ‘Medium’ in F60 and “Low” in F61.Use an appropriate function and place the answers starting from G58 until G61 to help you get the result for this category. Put the label Total in F62 and the answer in G62 for the Severity level using the appropriate function.
Find the percentage of Critical and High severity levels. Type the Percentage of Critical and High Severity levels in cell F66 and give the answer based on a suitable function/formula in cell G66.
Step 3: Data Visualisation
Visualise your report by creating TWO (2) appropriate charts.
1. Insert both charts in a new sheet named CHARTS:
a. Chart 1 – Cyber Threat Incident by Category (3D Bar Chart).
b. Chart 2 – Cyber Incidents by Region (Clustered Bar Chart)
2. Apply chart styles with complete Axis titles using the Chart element and move them to the ‘CHARTS’ sheet.
Take our academic assistance & get 100% plagiarism-free papers
Buy to Contact Us
Step 4: Discussion and Submission
Create a new sheet named ‘ANALYSIS’ and write a discussion (not more than 100 words) on Cyber Security Threat Patterns and Regional Insights based on charts 1 and 2.
Create a new sheet and name it RUBRICS. Create a rubric table as shown in the figure below. Leave cells B4:H4 empty. In cells B5:H5, use formulas to calculate student marks and insert a function at 15 to calculate total student marks.

Format all tables in the file nicely using Table Style.
Notes
- Late submissions will be heavily penalised, and plagiarism is PROHIBITED.
- Submission due date for this assignment: 11:55 PM 23/3/2025 (Week 9).
- Name the spreadsheet file as yourStudentID_assignment2.xlsx and turn in your work by submitting it in UFUTURE (Assignment).
- Total mark = 100 (20% of Continuous Assessment