QUESTION 1)
We model the salary of the average inhabitant of Pinkland. Salaries are a function of education (expressed in years), working hours (expressed in hours), firm sales and sector. There are 3 sectors in Pinkland, namely agriculture, industry and service.
Salaries are expressed in pinkies (currency of Pinkland). The model is estimated as follows:
Log(salary) = 1.2+ 0.08*educ+ 0.6*log(hours) + 0.16*log(sales) + 0.37*industry +0.56*service N=800
R2 = 0.78
- Interpret the coefficient on education. What type of relationship is this?
- Interpret the coefficient on “hours” and “sales”. What type of relationship are these?
- We have 3 categorical variables in the regression. Which is the base category?
- Interpret the coefficient on “industry” and “service”.
- Interpret the R2. Is this high enough in your opinion?
Don’t forget: Log referrers to natural logarithm!
QUESTION 2
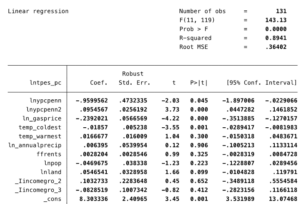
We model energy use per capita of 131 countries in a given year as follows:
Lntpes_pc =
The variables are defined as follows:
Lntpes_pc = log of total primary energy consumption per capita (ktoe)
Lnypcpenn =log of GDP per capita (USD)
Lnypcpenn2 = square of log of GDP per capita (USD)
Ln_gasprice = log of pump price for gasoline (USD/liter)
LnAnnualprecip= log of annual precipitation (mm)
Temp_coldest = average temperature for the coldest month in a year (in C)
Temp_warmest= average temperature for the warmest month in a year (in C)
ffrents = Fossil Fuel Rents (% of GDP)
LnPop = log of population (in millions)
LnLand = log of land area (in km2)
I_Incomegroup = refers to income groups “1” , “2” and “3”, low, mid and high income countries.
*” Log” always refers to natural logs or “ln” here.
Log referrers to natural logarithm!
- Interpret the constant and its p-value.
- Interpret the coefficient on gas price and its p-value.
- Interpret the coefficient on annual precipitation and carry out a t-test to determine the significance of the coefficient.
- Interpret the coefficient on population and its p-value.
- The above model belongs to the class of nonlinear equations. Calculate the turning point of the nonlinear relationship.
- Is this a U-shaped or inverted U-shaped relationship?
- Analyse the relationship between energy use per capita and GDP pc based on these insights. How does energy use per capita change with GDPpc? Prepare a graph!
- Please define MLR 2 and describe if MLR 2 is likely to hold or not?
- Please define MLR 4 and describe if MLR 4 is likely to hold or not?
Critical values for the standard normal distribution (z)
| Confidence level(1-α) | Level of Significance(α) | Two-Sided Critical Valuecα/2 |
One-Sided, Upper-TailCritical Valuecα |
One-Sided, Lower-TailCritical Value-cα |
| 90% | 10% | 1.645 | 1.28 | -1.28 |
| 95% | 5% | 1.96 | 1.645 | -1.645 |
| 99% | 1% | 2.58 | 2.33 | -2.33 |