Foreign Direct Investment And Economic Growth
Economic theory suggests that foreign direct investment affect economic growth (the growth of the Gross Domestic Product (GDP)) in developing countries. The objective of this project is to carry out a simple linear regression analysis to examine this theory. Your independent and dependent variables are the growth of the foreign direct investment and the economic growth (the growth of the Gross Domestic Product (GDP)) respectively.
Required Tasks:
1. State the regression model and determine the least-squares regression line.
2. What sign did you expect the estimated parameter to have? Explain.
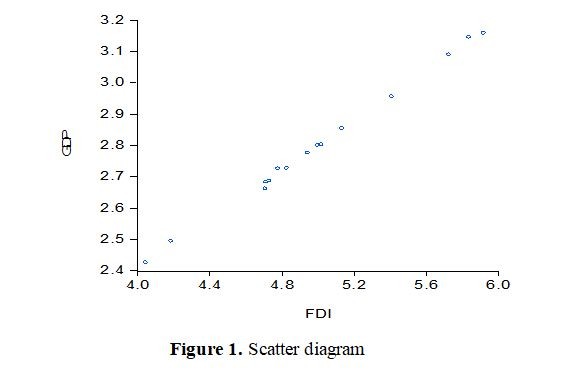
3. Use the scatter diagram presented in figure 1 to comment on whether it appears that a linear model might be appropriate.

4. Complete the table
| Variable | Coefficient | Std. Error | t-Statistic | Prob. |
| C | 0.825323 | 0.025088 | …………. | 0.0000 |
| FDI | 0.395143 | ………… | 79.13680 | 0.0000 |
| R-squared | 0.997928 | Mean dependent var | 2.799762 | |
| Adjusted R-squared | 0.997769 | S.D. dependent var | 0.215471 | |
| S.E. of regression | 0.010177 | Akaike info criterion | -6.213784 | |
| Sum squared resid | 0.001346 | Schwarz criterion | -6.119377 | |
| Log-likelihood | 48.60338 | Hannan-Quinn criteria. | -6.214790 | |
| F-statistic | 6262.633 | Durbin-Watson stat | 2.011334 | |
| Prob(F-statistic) | 0.000000 | |||
5. Write the regression line.
6. Conduct a test of the coefficient of correlation to determine at the 5% significance level whether FDI is related to the GDP, as the theory suggests.
7. Conduct a test of the regression slope to determine at the 5% significance level whether a positive and significant linear relationship exists between the two variables.
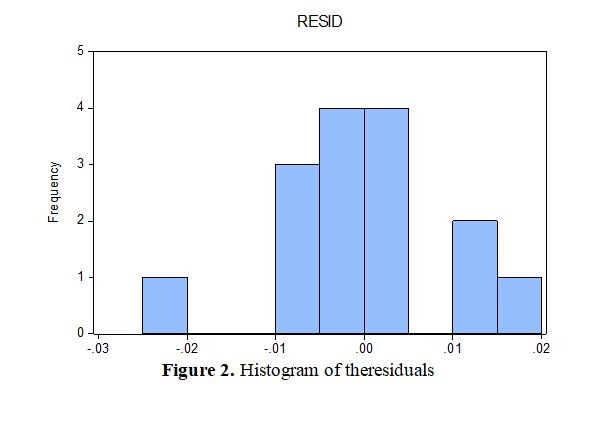
8. Does it appear that the error variable is normally distributed? Explain. (Refer to the Histogram of the residuals presented in figure 2.
