| MTH319: Mathematical Methods I |
Question
In a local community of 1.25 million residents, a pandemic has struck and the local health authorities have been battling it for some time through measures of wearing personal protective equipment and social distancing, etc.
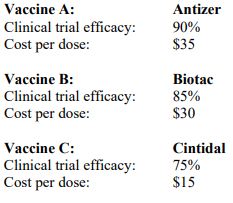
Now that vaccines have been created and are made available, the pandemic response team (PRT) wants to study the possibilities of implementation. To date, there are 3 vaccines that have been tested and approved by the world health authority. The details of each vaccine are given in the table below.

You have been engaged as a data analyst by the PRT, who has the following considerations.
(a) In an attempt to achieve ‘herd immunity, the PRT is aiming to vaccinate 64% of its community with a mean vaccine efficacy of 80%. The total cost of purchasing the vaccines is budgeted at $17.5 million (assumed to be spent entirely).
Form a system of linear equations representing these requirements and solve it for the number of doses of each vaccine needed. Demonstrate the use of matrix row operations in your solution. The mean vaccine efficacy can be calculated from:
where ηi is the efficacy of each vaccine and xi is the number of persons taking that vaccine.
(b) The world health authority has decided to provide the PRT some monetary assistance, hence enabling them to increase their budget of buying vaccines to $25.5 million (assumed to be spent entirely). The PRT is also considering achieving a higher mean vaccine efficacy of 85%.
Based on these two requirements, form a system of 2 linear equations and solve it. Show that there are infinitely many solutions and explain its meaning in the context of the vaccination problem.
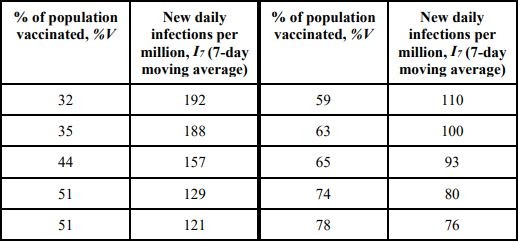
(c) Some studies have been conducted on various countries on their vaccination drives and the following findings relating the vaccinated percentage to the new daily infections (7- day moving average) are tabulated in the dataset below.

By performing a linear regression of the above dataset based on minimizing of the sum of squared errors, determine the predictive function:
where parameters a and b represent respectively the gradient and y-intercept of the linear-fit. Provide a screenshot of the dataset and your predictive function plotted in one graph to show the fit.
(d) In order to prevent the healthcare facilities from being overwhelmed, the PRT wants to reduce the new daily infections in the community of 1.25 million residents to a maximum of 100 (based on the 7-day moving average). With reference to the predictive function in part (c), determine the minimum percentage of the local community population that needs to be vaccinated in order to achieve this goal. Give your answer to the nearest whole percent.
Then, combining with the two requirements in part (b), determine the number of doses of each vaccine to be purchased by the PRT in their vaccination drive.
(e) A salesperson of the Biotech vaccine claims that since the PRT wants to achieve a mean vaccine efficacy of 85%, they should only purchase Biotac because it has a vaccine efficacy of 85% as proven in clinical trials. Considering the requirements in parts (b) and (c), advise the PRT on whether the salesperson’s claim should be followed.
(f) Express your solution in part (b) using a vector equation.
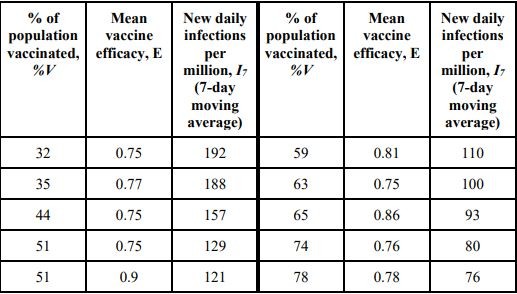
(g) Self-learning problem: The dataset shown in part (c) generated from studies on the vaccination drives in various countries has been expanded to include the mean vaccine efficacy.

Using multiple linear regression by minimizing the sum of squared errors, obtain the predictive function:
where a, b and c are parameters to be determined. Provide a screenshot of the dataset and your predictive function plotted in one graph to show the good fit. Based on the model, comment on the effectiveness of vaccination percentage and vaccine efficacy in controlling the spread of infections.
To avoid manual calculation hassle and mistakes, you are advised to write a simple Python program to calculate the matrices and plot the graph.