| HBC203: Statistics and Data Analysis for the Social and Behavioural Sciences |
Question 1
For this question, you will need the file, “HBC203_TMA01_Q1.csv”. This file contains a subset of the Singapore data from the 2012 World Values Survey, after non-responses have been deleted. There are three variables in the file:
- Sex, where 1 = male, 2 = female
- Age
- Happiness, where 1 = Very happy, 2 = Rather happy, 3 = Not very happy, 4 = Not at all happy
a. Import the file into jamovi. Then, where necessary, change the levels so that they are informative (e.g., under Sex, instead of “1”, we see “Male”). Change the measure type to match the scale of measurement of the variable. Take a screenshot of the jamovi spreadsheet (i.e., what you see when you click the DATA tab). Paste the screenshot in your answer. Make sure you capture the three variables in your screenshot.
b. Using jamovi, analyse the data to find the number of males and females who responded to the survey. Paste the relevant output from jamovi to support your answer.
c. Using jamovi, analyse the data to get the mean and the standard deviation of the Age variable. Paste the relevant output from jamovi to support your answer.
d. Show the distribution of the Age variable. Paste the relevant output from jamovi to support your answer.
e. Use jamovi to calculate the percent of the total respondents who were at least rather happy (i.e., rather happy or very happy). Paste the relevant output from jamovi to support your answer.
Question 2
A statistics instructor at SUSS is conducting a study to find out if spacing out assignment deadlines affects students’ performance on their assignments. She set both of her tutorial groups three assignments. However, she randomly assigned one tutorial group (n = 9) to have separate deadlines: Week 3 for the first assignment, Week 6 for the second assignment, and Week 8 for the third assignment. The second tutorial group (n = 9) had a single deadline:
Week 8 for all three assignments. The instructor graded all the assignments at the end of the semester, taking care to anonymity the assignments first. The total marks for the three assignments (marked out of a maximum of 30 marks) are in the table below.
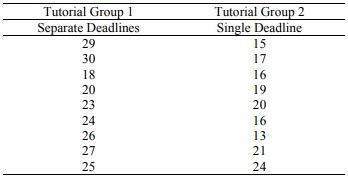
Note. Both the study and the data are hypothetical. For the purposes of this exercise, we are using a small sample size. However, in the “real world”, a much larger sample with more observations would be recommended for reliable results.
a. Identify the predictor variable. State the number of conditions and identify what the conditions are. Identify the outcome variable.
b. Identify the scale of measurement of the predictor variable and explain why.
c. Identify the scale of measurement of the outcome variable and explain why.
d. Identify if this an experimental or observational study. Explain why in the context of this study.
e. Identify if this is a between-subjects or within-subjects design. Explain why in the context of this study to support your answer.
f. Based on the study design, identify the most appropriate parametric statistical test to conduct. Discuss why this is the most appropriate parametric test by providing two reasons in the context of this study.
g. State the null hypothesis (H0) and the non-directional alternative hypothesis (H1).
h. Enter the data into jamovi. Add informative labels to your variables. Change the measure type to match the scale of measurement of the variable. Show the jamovi spreadsheet by taking a screenshot of the spreadsheet (i.e., what you see when you click the DATA tab) and pasting it in your answer. Make sure you capture the variables in your screenshot.
i. Assuming all the assumptions of the statistical test you identified in (f) are met and there are no concerns about small sample size, analyse the data by conducting the statistical test using jamovi. Paste the output in your answer. Remember to include the output for the descriptives (means and standard deviations), results from the inferential test, the confidence interval, and the effect size.
j. Interpret the results of your data analysis and examine whether there is a difference in the total marks between the Separate Deadlines condition and the Single Deadline condition. Explain your answer with reference to the p value and the alpha level. Use an alpha level of .05.
k. Discuss and report the results in APA format.
l. Assume that in this study, students in the separate deadlines condition had significantly higher marks on average than students in the single deadline condition. Can the statistics instructor conclude that spacing out assignment deadlines caused an improvement in students’ performance? Discuss why this would be so in the context of this study.
m. Assume that the statistics instructor’s population of interest is all Singaporean students. How well do you think the findings in this study can generalize to the population? Discuss why this would be so in the context of this study.
Question 3
Lynn decided to conduct a research study to find out which food delivery service, Deliveree or FoodMonkey, delivers her orders faster. She placed the same orders from 5 different restaurants via both Deliveree and FoodMonkey and recorded the amount of time each delivery service took to deliver her orders. Her data are presented in the table below:
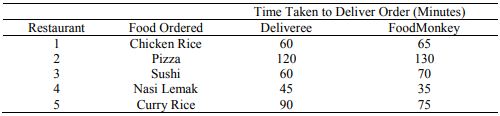
Note. Both the study and the data are hypothetical. For the purposes of this exercise, we are using a small sample size. However, in the “real world”, a much larger sample with more observations would be recommended for reliable results.
a. Identify the predictor variable. State the number of conditions and identify what the conditions are. Identify the outcome variable. (4 marks)
b. Identify the scale of measurement of the predictor variable and explain why.
c. Identify the scale of measurement of the outcome variable and explain why.
d. Identify if this an experimental or observational study. Explain why in the context of this study.
e. Identify if this is a between-subjects or within-subjects design? Explain why in the context of this study to support your answer.
f. Based on the study design, identify the most appropriate parametric statistical test to conduct. Discuss why this is the most appropriate parametric test by providing two reasons in the context of this study.
g. State the null hypothesis (H0) and the non-directional alternative hypothesis (H1).
h. Enter the data into jamovi. Add informative labels to your variables. Change the measure type to match the scale of measurement of the variable. Show the jamovi spreadsheet by taking a screenshot of the spreadsheet (i.e., what you see when you click the DATA tab) and pasting it in your answer. Make sure you capture the variables in your screenshot.
i. Assuming all the assumptions of the statistical test you identified in (f) are met and there are no concerns about small sample size, analyse the data by conducting the statistical test using jamovi. Paste the output in your answer. Remember to include the output for the descriptives (means and standard deviations), results from the inferential test, the confidence interval, and the effect size.
j. Interpret the results of your data analysis and examine whether there is a difference in the average delivery speed between Deliveree and FoodMonkey. Explain your answer with reference to the p value and the alpha level. Use an alpha level of .05.
k. Discuss and report the results in APA format.