Nanyang Technological University
Nanyang Business School
Feeding the Future:
Data Science Perspectives on Global Nutrition and Happiness
1. INTRODUCTION
Background
In a world increasingly shaped by health crises, evolving diets, and shifting measures of well-being, the intersection of nutrition, public health, and happiness is gaining renewed urgency. According to the World Health Organization (WHO), as of 2024, over 1 billion people globally, including 650 million adults, 340 million adolescents, and 39 million children, are classified as obese. In fact, obesity rates have tripled since 1975, and currently, over 40% of adults are overweight (WHO, 2024). This trend poses a serious threat to global health systems and is strongly correlated with an increased risk of chronic diseases, such as cardiovascular conditions, type 2 diabetes, and even certain cancers.
The WHO 2024 report calls for urgent action across the public and private sectors, including food manufacturers, governments, and healthcare providers, to improve the quality and nutritional balance of the global food supply. This includes a focus on reducing excessive caloric intake from fats and sugars and promoting diets rich in fiber and plant-based proteins. Such global guidelines make datasets on macronutrient intake and food composition especially relevant for contemporary analysis.
Simultaneously, the United Nations Sustainable Development Solutions Network (UNSDSN) published the World Happiness Report 2023, which ranks over 150 countries based on factors such as income, social support, life expectancy, freedom, and perceptions of corruption. Interestingly, nutrition and food security, but not direct ranking factors, play essential roles in many of these dimensions. Countries with healthier food systems and greater access to nutritious food often report better physical and mental well-being, which is intricately linked to happiness.
The World Happiness Report frames well-being as a central pillar of sustainable development, aligning with UN Sustainable Development Goals 3 (Good Health and Well-Being) and 2 (Zero Hunger). As nations grapple with how to meet these goals, data-driven insights into nutrition trends, caloric distribution, and food industry offerings have become invaluable.
2. Dataset
In this project, we utilized two sources of data:
1. Daily caloric supply derived from carbohydrates, protein and fat,United States, 1961 to 2022 (daily_intake) retrieved from https://ourworldindata.org/diet-compositions#introduction
2. Simulated food intake, 2015 to 2020 (simulated_food_intake_2015_2020)
Entity: countries
Year: year
Month: month (1 to 12)
Daily_calorie_animal_protein: daily calorie from animal protein
Daily_calorie_vegetal_protein: daily calorie from vegetable protein
Daily_calorie_fat: daily calorie from fat
Daily_calorie_carbohydrates: daily calorie from carbohydrates
3. World Happiness Report (happiness)
retrieved from https://www.kaggle.com/datasets/unsdsn/world-happiness
4. McDonalds Nutrition Dataset (mcdonaldata)
retrieved from https://www.kaggle.com/datasets/priyanshusethi/mcdonalds-nutrition-dataset
5. Burger King Menu Nutrition Data (burger_king_menu)
retrieved from https://www.kaggle.com/datasets/mattop/burger-king-menu-nutrition-data
6. Starbucks Nutrition Facts (starbucks)
retrieved from https://www.kaggle.com/datasets/utkarshx27/starbucks-nutrition
To reduce your workload (and demand for computational resources), you are provided with mySQL and MongoDB database instances. Please note that the databases may contain unknown issues (e.g., special characteristics, unexpected null values, inconsistent data types), which are inherent in the data sources.
For Q1 to Q15, your queries must be constructed based on the existing data structures (e.g., no additional tables/collections, no views, no temporary tables).
For Q16 to Q18 and Q19 to Q23, you may modify the existing data structures and introduce additional data (tables and collections).
3. Project Deliverables
The due date for the group project is 15 November 2025, 23:59 (23:59 hrs NTULearn server time)
There are several key deliverables (and one set of optional deliverables), namely
- 1 x project report (non-technical)
- 2 x script files (SQL and noSQL; you must include in-line comments to explain the logic/ assumptions)
- 1 x presentation
- [optional] database implementations (e.g., relational database and nonrelational database for additional data). Please provide a short note to guide the deployment procedure.
PROJECT REPORT
The report should contain the following:
- A cover page that includes a title, names, and matric numbers of each team member.
- Discussion on the data-driven insights specific to Q16 to Q18 and Q19 to Q23. You may include additional aids to illustrate your discussion (e.g., charts and graphs generated based on the data output of your queries).
- The completed Task Allocation Sheet.
PRESENTATION
Your team is expected to deliver a video-recorded presentation (which must be made available via YouTube), in which the team is expected to:
- Discussion on the data-driven insights specific to Q16 to Q18 and Q19 to Q23.
- If relevant, any implementation considerations.
The entire presentation MUST be within 20 minutes (video duration beyond 20 minutes will be ignored). All members must present. Each member is expected to contribute equally to the presentation.
Consultations
You are expected to make relevant and logical assumptions when attempting to answer the questions. For blue-sky questions, you may need to incorporate additional datasets. To these ends, you are expected to consult your class instructors.
Please note that your team is expected to provide periodic updates whenever possible (e.g., after instructional periods, during class exercise time, and during dedicated consultation time).
4. SUBMISSION
A submission folder will be made available on NTULearn. Please zip the files and make a single file submission. One member will complete the submission on behalf of the group.
The following files must be submitted to complete this group project:
- Project report (in pdf format)
- YouTube URL (in a text file, please ensure the URL is viewable)
- Script files
- [optional] Database implementations
In the unlikely event that your submission file is larger than the permissible size on NTULearn, please contact your instructor to arrange for an alternative submission arrangement.
The submission must be made by 15 November 2025, 23:59. Do note that video processing and YouTube uploading can be computationally intensive and bandwidth-demanding. Please ensure ample time for processing and uploading the presentation video.
Hire a Professional Essay & Assignment Writer for completing your Academic Assessments
Native Singapore Writers Team
- 100% Plagiarism-Free Essay
- Highest Satisfaction Rate
- Free Revision
- On-Time Delivery
Appendix – 23 questions (30 marks)
For Q1 to Q15 (a total of 15 questions), each member must complete two questions (e.g., a 5-member team will complete a total of 10 questions). For each question, the member must complete both the SQL and noSQL scripts.
1 mark (max) for each SQL/noSQL implementation. The entire group receives 1 mark (max). Therefore, 4 x 1 + 1 = 5 marks (max) per member.
For Q16 to Q18 (a total of 3 questions), all questions must be completed (for teams with fewer than five members, consult your instructor for adjustment). Each question can be attempted (led) by at most two members, who make equal contributions to both the SQL and noSQL scripts.
4 marks (max) for each member (SQL and noSQL are considered jointly). The entire group receives 1 mark (max). Therefore, 4 + 1 = 5 marks (max) per member
For Q19 to Q23 (a total of 5 questions), all members can contribute. All questions must be completed (for teams with fewer than five members, consult your instructor for adjustment).
6 marks (max) for each member (SQL and noSQL are considered jointly). The entire group receives 4 marks (mark). Therefore, 6 + 1 = 10 marks (max) per member.
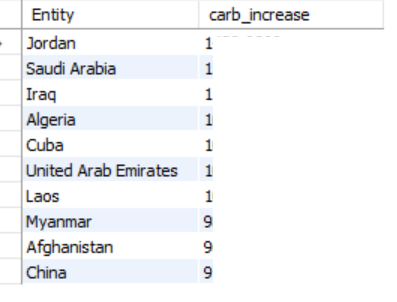
1. [daily_intake] What are the countries with the greatest increase in carbohydrate intake over time?
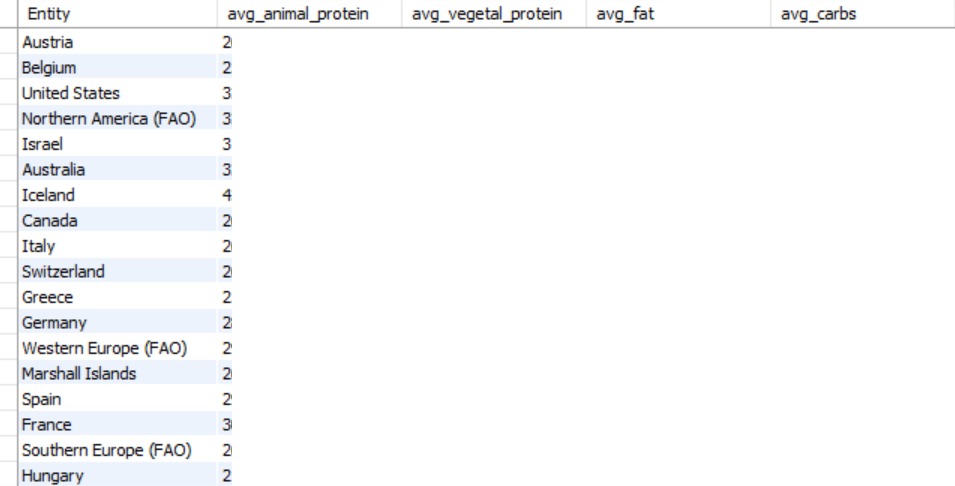
2. [daily_intake] What are the average macronutrient intake for the last 10 years by country?
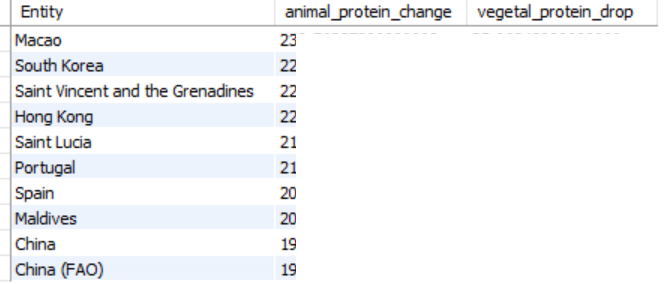
3. [daily_intake] identify the top-10 countries (by animinal protein change) shifting from high-vegetal to high-animal potein diets.
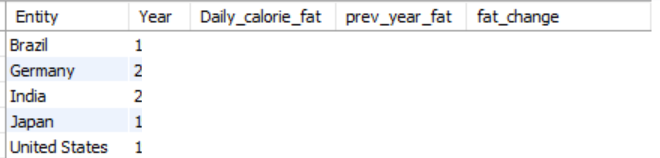
4. [daily_intake] Consider ‘United States’, ‘India’, ‘Germany’, ‘Brazil’, ‘Japan’. For each country, compute the year-over-year change in daily calorie intake from fat, and find the year with the maximum increase.
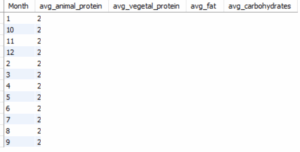
5. [simulated_food_intake_2015_2020] List the average monthly intake by nutrient.
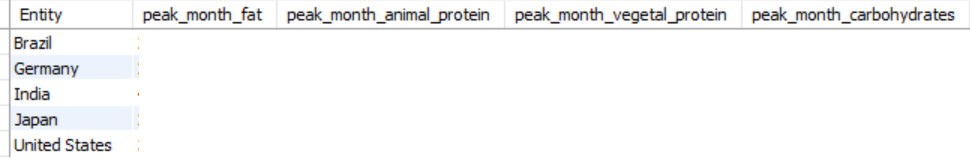
6. [simulated_food_intake_2015_2020] Consider ‘United States’, ‘India’, ‘Germany’, ‘Brazil’, ‘Japan’. Identify the corresponding seasonal spikes (month) in intake.
7. [happiness]
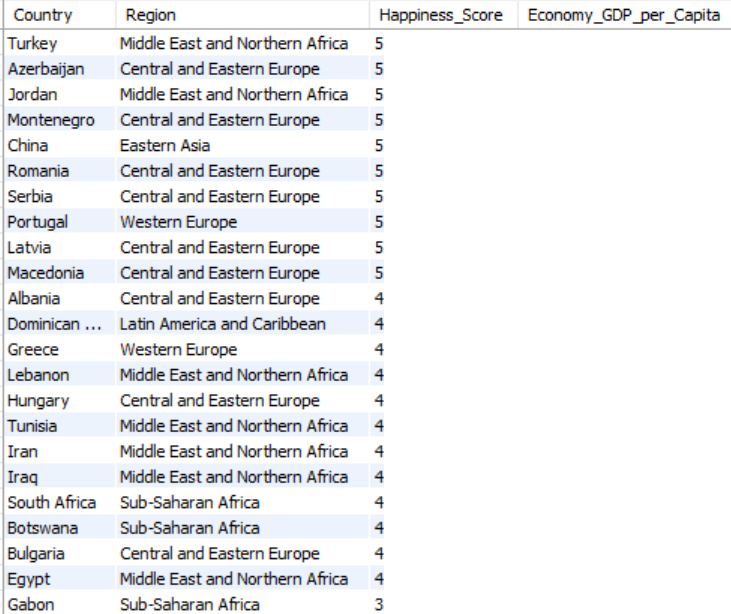
Detect Outliers – Countries with High GDP but Low Happiness.
8. [happiness]
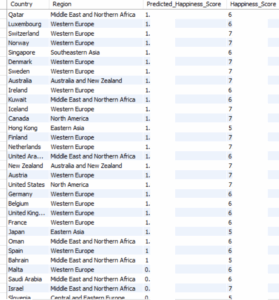
Predictive Composite Metric (Weighted Index)
9.[mcdonaldata]
Calculate fat-to-protein ratio (efficiency indicator)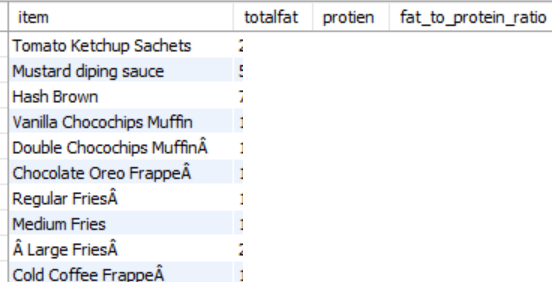
Note: fat-to-protein ratio = totalfat/protien
10. [mcdonaldata]
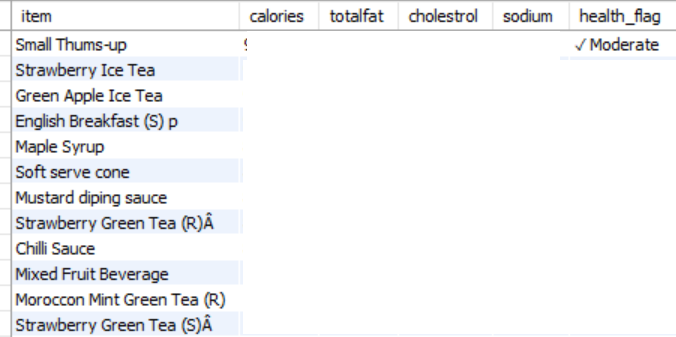
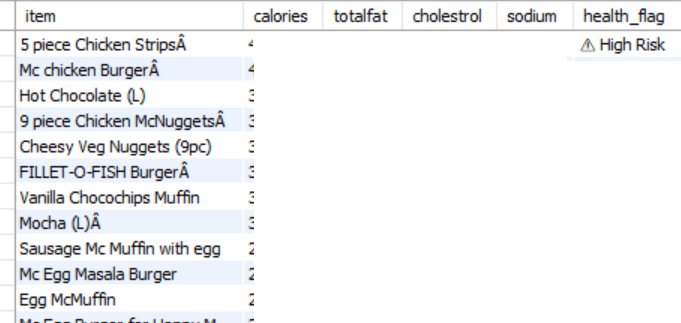
List items with high sodium + fat + cholesterol
The two figures above depict result grid of the same output (not two independent outputs).
Note: totalfat > 30 OR sodium > 1000 OR cholestrol > 30′, then health_flag = ⚠ High Risk’ else health_flag = ✓ Moderate
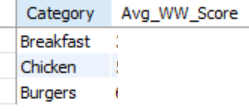
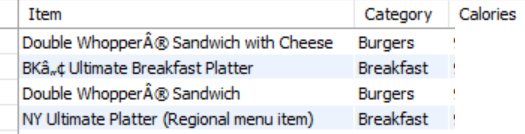
11. [burger_king_menu] Which Categories Are Most Weight Watchers-Friendly?
12. [burger_king_menu] List the top 10 most caloric menu items.
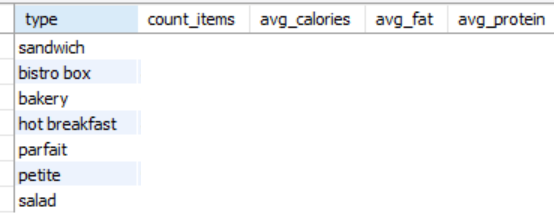
13. [starbucks] Bakery vs. Non-Bakery: Nutrition contrast
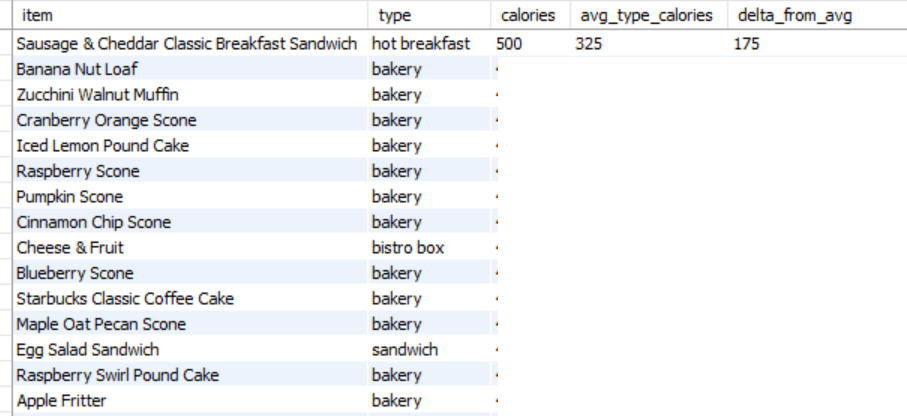
14 [starbucks] Compare Each Item to Average Calories in Its Type. Shows how far above or below the average each item is within its group.
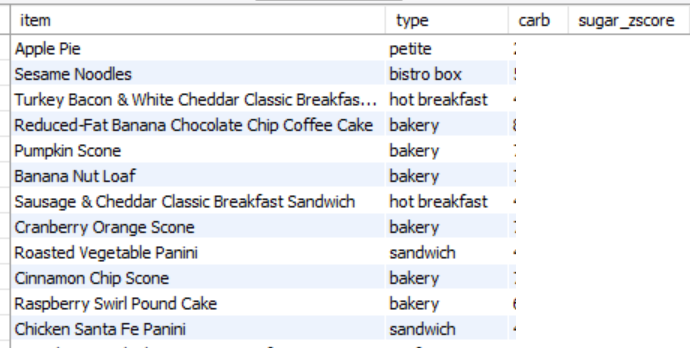
15. [starbucks] List the category-level (i.e., sandwich, bakery) Z-score for sugar.
16. *Open-ended question [simulated_food_intake_2015_2020] and [happiness]
Do countries with higher average protein/fat intake during winter months tend to report higher happiness?
TIP: You need to define the winter months.
17. *Open-ended question; [daily_intake] and [happiness]
Do long-term fat intake trends (from 1961–2020) correlate with happiness?
TIP: Imagine you need to prepare the data to plot a bar chart. For each country, a bar represents the level of happiness score, and another bar represents the level of average fat intake.
18. *Open-ended question [daily_intake] and [happiness]
Are countries with lower monthly nutrient variation happier?
TIP: To calculate variation, consider STDDEV(). https://www.tutorialspoint.com/mysql/mysql_aggregate_functions_stddev.htm
19. *Blue-sky question
Country Trends: Processed Food Intake vs. Fast Food Menu Health
Are there any relationships between processed food intake and fast-food menu? What can be the impact of processed food and fast-food consumption on happiness? What about health outcomes?
20. *Blue-sky question
Does fast-food consumption increase health risk? Could the risk be mitigated?
21. *Blue-sky question
Long-term dietary transition for epidemiological analysis
Are there any notable nutritional shifts in the US? What can be the explanation? Wealth? Healthcare? Availability? Preferences? Social trends (e.g., plant-based, fat-burning juices, protein fluff)?
22. *Blue-sky question
What months should governments increase public awareness of unhealthy food spikes? For example, are there healthy fast-food options that can be promoted via public campaigns? What healthy fast-food options can be introduced? What makes these options suitable?
23. *Blue-sky question (compulsory for teams with >4 members)
What is the impact of reduction of fat or sugar-based diets on happiness, health, and economic outcomes? Should countries explicitly regulate sugar consumption (e.g., mandatory reduced-sugar beverage, sugar tax)? Or, should countries employ implicit policies (e.g., awareness promotions, provision of healthy options)?
Notes: When additional datasets are considered, your team must provide formal references/sources to retrieve the original datasets.
Evaluation will be performed with attention to the coherence of your team’s narrative. A coherent data narrative can be achieved using a focused dataset. A rich, diversified dataset can muddle the narrative if the data is not meaningfully integrated.
Buy Custom Answer of This Assessment & Raise Your Grades
BC2402 Group Project – Task Allocation
| Question (Individual = 4 marks, group = 1 mark) | Member (strictly only one member for both SQL and noSQL) |
| 1 | |
| 2 | |
| 3 | |
| 4 | |
| 5 | |
| 6 | |
| 7 | |
| 8 | |
| 9 | |
| 10 | |
| 11 | |
| 12 | |
| 13 | |
| 14 | |
| 15 |
If a question is not attempted, leave the corresponding member entry blank. If more than a single member is listed for a question, both members receive a 50% penalty for the question, and the team gets a 10% overall penalty. Members who did not attempt any questions from Q1 to Q15 receive zero marks individually. The team gets a 10% overall penalty.
| Question (Individual = 4 marks, group = 1 mark) | Strictly 2 members maximum | |
| Member 1 | Member 2 | |
| 16 | ||
| 17 | ||
| 18 | ||
If a question is not attempted, leave the corresponding member entries blank. If more than two members are listed for a question, the members receive a 50% penalty for the question, and the team gets a 10% overall penalty. Members who did not attempt any questions from Q16 to Q18 receive zero marks individually. The team gets a 10% overall penalty.
| Question | Members (no limit) | Note |
| 19 | ||
| 20 | ||
| 21 | ||
| 22 | ||
| 23 |
If a question is not attempted, leave the corresponding entries blank. You may use the note to provide additional details about specific task allocations within the question. Members who did not attempt any questions from Q19 to Q22 receive zero marks individually. The team gets a 10% overall penalty.
BC2402 Group Project – Marks Allocation
The entire project contributes 30% (marks) to each individual’s overall assessment.
There are three key components, namely
A. SQL and noSQL solutions = 20 marks
a. Q1 to Q15 (individual = 4 marks, group = 1 mark, total = 5 marks)
b. Q16 to Q18 (individual = 4 marks, group = 1 mark, total = 5 marks)
c. Q19 to Q22 (individual = 6 marks, group = 4 marks, total = 10 marks)
B. 1 x project report = 5 marks
C. 1 x presentation = 5 marks (individual = 3 marks, group = 2 marks)
Do note that peer evaluation exercises will be conducted. Results of the peer evaluation exercises will be considered in individual grading.
Stuck with a lot of homework assignments and feeling stressed ?
Take professional academic assistance & Get 100% Plagiarism free papers
The post BC2402 Designing and Developing Databases Group Project Semester 1 2025/26 appeared first on Singapore Assignment Help.